Missing slice: photoHero


A new question does not require a new study.
Every answer is kept at the level of the individual respondent, so a question first asked this week can be put to data collected last March.
6,000
interviews a year, per market, ages 18–79
100
+
brands measured in every category
40
need questions behind eight positions
92–93
%
correlation between brand equity and market share
01
Survey data is one of three inputs
Representative survey data is the foundation. On top of it: what is said about the brand in podcasts and social media, and how AI assistants describe the category.
02
Stored per respondent, screened every wave
Answers are kept as individual responses, not as a finished table. A cut nobody planned for is a query against data you already have, not another round of fieldwork.
03
100+ brands, 40 questions, 8 positions
Forty category questions are reduced to eight need positions. Every brand in the category is scored on all of them, including the competitors you did not put on the list.
04
Ask the data, not the dashboard
Put a question to your own research data in plain language, then follow a movement down into the segments, associations and competitors that produced it.

The category does not move on a quarterly schedule.
What changes when the tracker never stops
Basic tracker
A wave every quarter
New data one to two days after month close
The ten brands you listed
Every brand in the category — 100 and up
Survey answers only
Surveys, podcast and social conversation, AI answers
Aggregated tables
Every answer kept at respondent level
A new question means new fieldwork
A new question is a new cut of data already collected
A deck you read
A model you can put a question to
Three decisions behind the method
Most of what separates this from a standard tracker was settled before a single answer was collected.
Every brand, not a shortlist
Category coverage
- 100+ brands per category, 40 need questions each
- A competitor you never named is already in the data
- Scored on the same eight positions as you are
100+ brands per category
Every answer, not a table
Respondent-level storage
- Responses stored one by one, not pre-aggregated
- Any cut of data already collected is available later
- Quality and fraud screening on every wave
Respondent-level storage
Every month, not every quarter
Collection cadence
- Fieldwork runs every day of the year
- 6,000 interviews a year per market, ages 18–79
- New data one to two days after month close
Monthly, 1–2 days after close
Energy Signal is a new approach to insight work in our industry and serves as a strong complement to our own research. Above all, it helps us conduct clear competitor analyses when it comes to new services.
Ola Sandberg
Head of Insight and Foresight, E.ON
What the data already answers
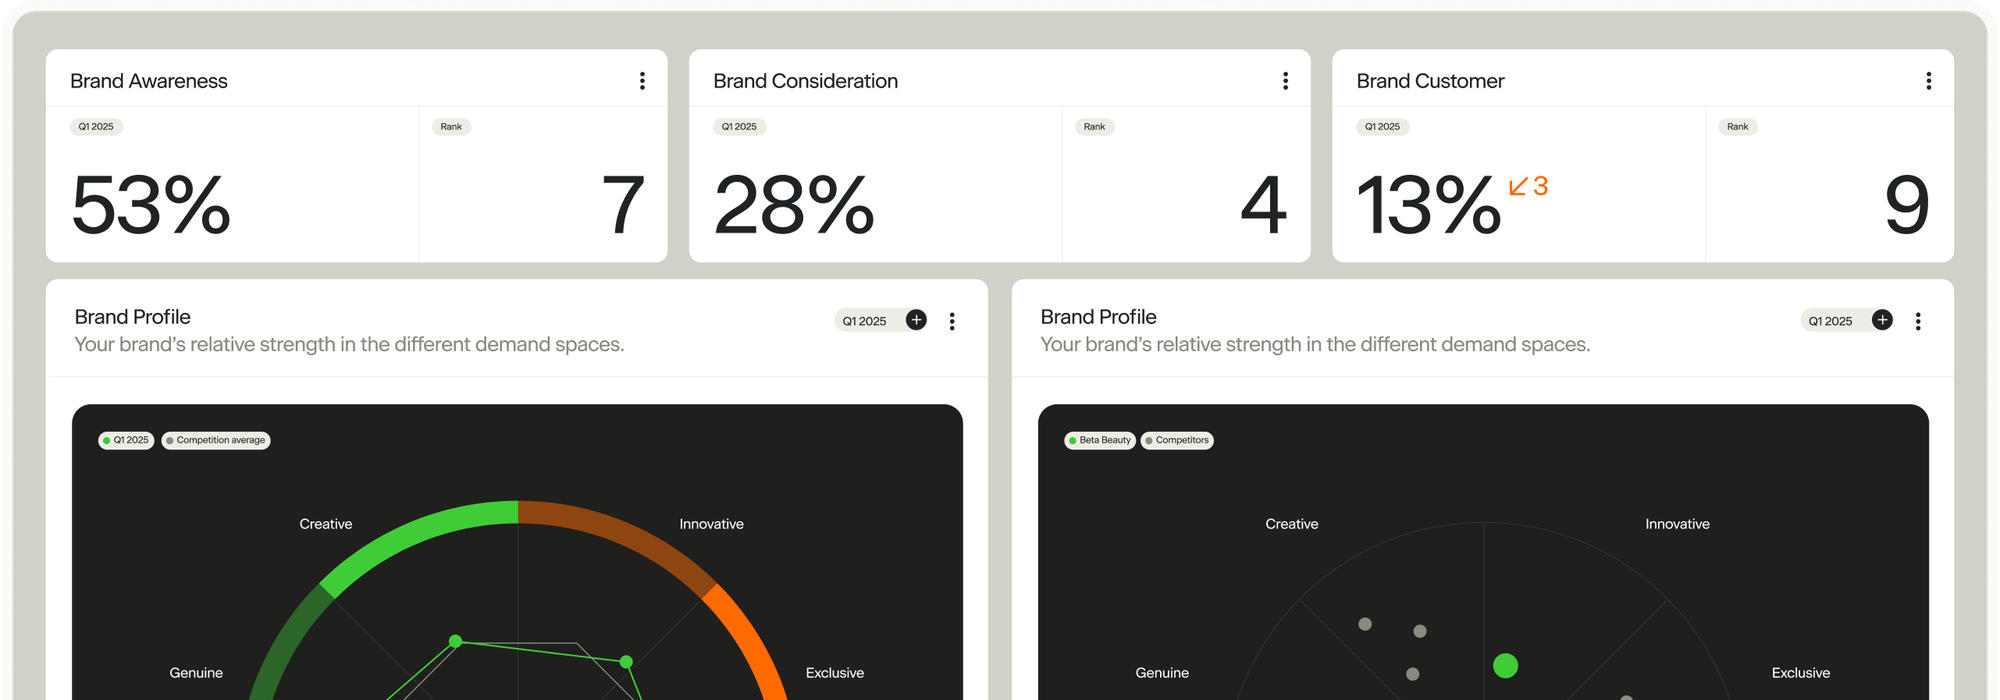
Awareness, consideration, purchase
Where the funnel narrows, for you and for every competitor, month by month.
Brand equity
One figure weighing awareness, consideration and preference. Correlates 92–93 % with actual market share.
Gap analysis
What buyers rate as important, and where you are not yet credited for it.
Need positions
Forty category questions reduced to eight positions, scored for every brand in the list.
Segments
Any cut of the data already collected — age, region, category behaviour — without new fieldwork.
Conversation and AI answers
What is said in podcasts and social media, and how AI assistants describe the category.
Collected — no dedicated view yet
Awareness, consideration, purchase
Where the funnel narrows, for you and for every competitor, month by month.
Brand equity
One figure weighing awareness, consideration and preference. Correlates 92–93 % with actual market share.
Gap analysis
What buyers rate as important, and where you are not yet credited for it.
Need positions
Forty category questions reduced to eight positions, scored for every brand in the list.
Segments
Any cut of the data already collected — age, region, category behaviour — without new fieldwork.
Conversation and AI answers
What is said in podcasts and social media, and how AI assistants describe the category.
Collected — no dedicated view yet
Four situations this gets bought for
Each of these came from an insight lead who already ran a tracker and needed a cut it could not give her.

Which of the eight positions is under-owned, and can we credibly take it?

What are they being credited for, and which associations moved away from us?

Which segments are large, reachable and already halfway to considering us?

A new entrant, a price shift, a rule change: what did it move, and for whom?
Missing slice: editorial
Missing slice: aiExploration
What insight leads ask before they switch
Why is our awareness number lower than in our old tracker?
Because the list is longer. A standard tracker prompts on ten brands; we prompt on every brand in the category, often thirty-five or more. People tick eight to ten names either way, so the same recognition spreads across more names. The figure is not worse: it is measured against the whole market rather than a shortlist, which is what makes it comparable across competitors and over time.
How often does the data update?
Collection runs continuously, every day of the year. New data appears in the platform every month, one to two days after the month closes.
Which markets are running?
Sweden and Norway are live; Norway since January 2025. Denmark and Finland open in autumn 2026.
What is it built on?
Representative survey data collected continuously rather than in fieldwork windows, plus conversation data from podcasts and social media, and how AI assistants answer about the category. Every wave is screened for quality and fraud before it enters the platform.
Can I ask my own questions of the data?
Yes. You ask against your own research data in plain language, cross-analyse brands, segments and metrics, and follow a movement into the audiences and associations behind it.
What is not in the platform yet?
Conversation and AI visibility data is collected but does not yet have a view of its own, and there is no single screen for reading the sources against each other. We do not attribute revenue to campaigns, and we do not set your positioning.
Platform
Solutions
Resources
Privacy Policy
© All rights reserved