Missing slice: photoHero
Missing slice: editorial
Every brand in the category, every month, kept at the level of the single answer.
How a figure is made
Three steps, the same three every month. Nothing here is inferred from a shortlist of ten brands.

1. Ask about everyone
Six thousand people a year per market, aged eighteen to seventy-nine, asked about every brand in the category rather than a chosen few.

2. Fold forty questions into eight
Around forty questions about what people want from a category reduce to eight positions — affordable, trustworthy, innovative and so on.

3. Weigh three things into one
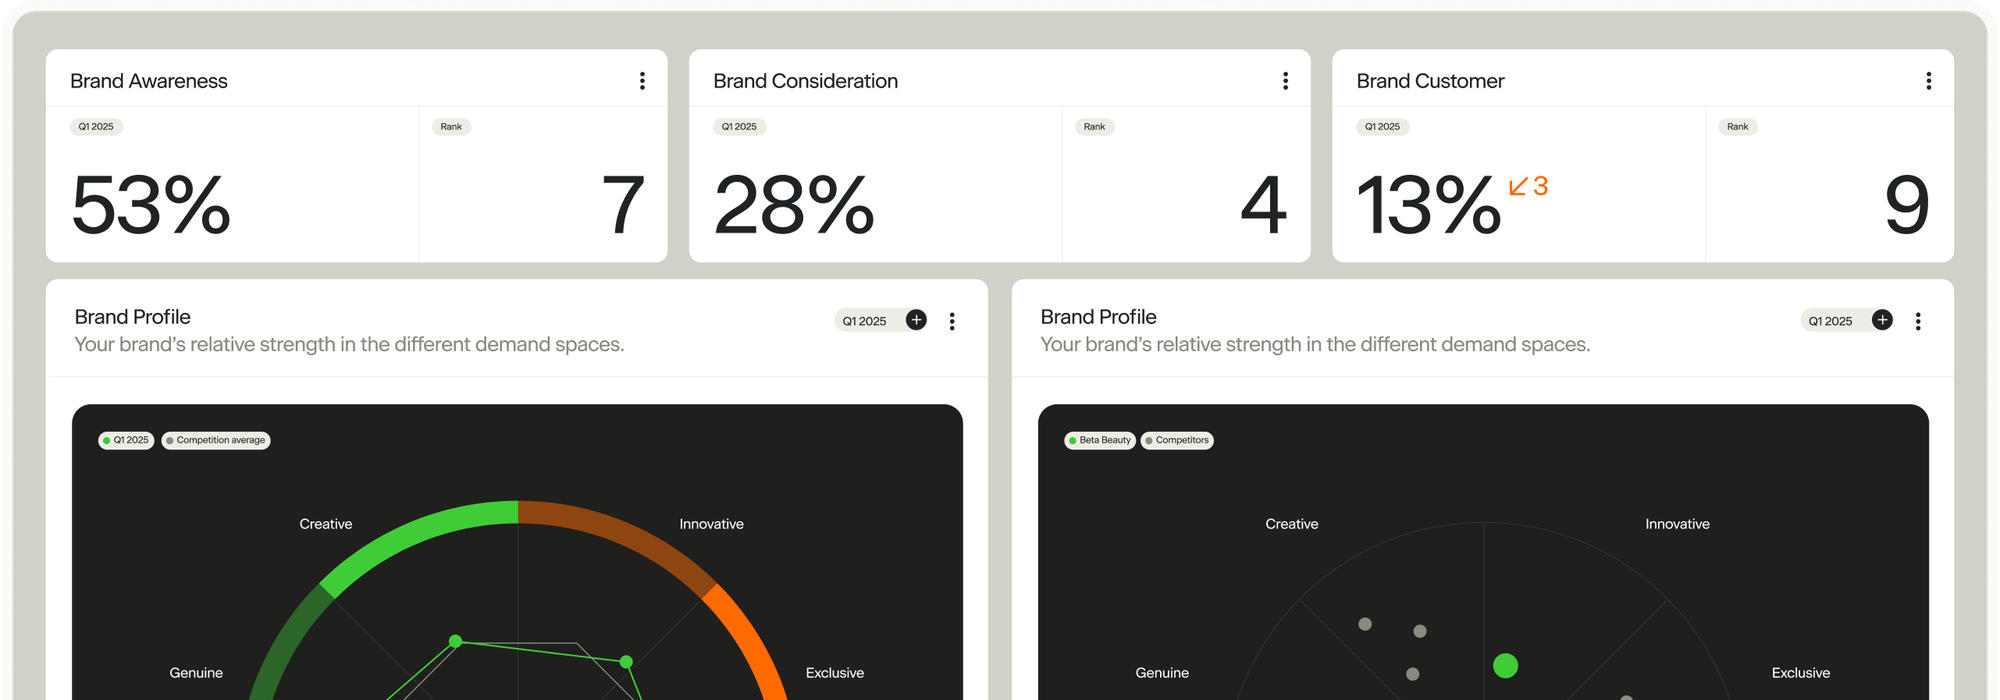
Awareness, consideration and preference weigh into Brand Equity. Against actual market share it correlates at ninety-two to ninety-three per cent.
6,000
interviews a year, per market
100
+
brands measured per category
40
needs questions behind the eight positions
1–2
days after month end, the month is live
Missing slice: blurChapters


The data is already collected. The question is the new part.
Method, side by side
Basic tracker
A snapshot at each wave
A model that keeps updating, every month
Ten brands you picked
Every brand in the category — 100 and up
Survey data only
Surveys, conversations and how AI describes you
A report on a schedule
A model you can ask a new question of
A new study for a new question
The answer is already in the data
An arrow with no stated baseline
The comparison period next to the arrow
Method in an appendix, if at all
Method stated beside the number
Who asks for this
Four jobs, four different weeks.

Where is there actually room to move — and can we credibly own it?

What are they taking ownership of, and at whose expense?

Which groups are attractive, reachable and credible for us?

Are we gaining or losing ground in how AI describes the market?
Missing slice: aiExploration
Method questions, answered plainly
Why is our number lower than in our previous tracker?
Because the list of brands is longer. A basic tracker shows ten; we show every brand in the category, often thirty-five or more. People tick eight to ten names either way, so the same behaviour spreads across more of them. The figure is lower because it is measured against the whole market.
How representative is the sample?
Six thousand interviews a year per market, aged eighteen to seventy-nine, balanced by age and region. Collection runs every day of the year rather than in fieldwork windows, so a single bad week cannot set the level for a quarter.
What is Brand Equity, exactly?
One figure that weighs awareness, consideration and preference together. Measured against actual market share it correlates at ninety-two to ninety-three per cent, which is what makes it usable as a headline number rather than a curiosity.
What does an arrow compare against?
The previous month, unless the period selector says otherwise. The comparison period is written next to the figure, because a change without a stated baseline is not a finding.
How often does the data update?
Every month, one to two days after the month closes. That is short enough to see whether something you did in March had moved anything by April.
Which markets and categories are covered?
Category models run across the Nordics. Norway has been live since January 2025. Denmark and Finland come online in autumn 2026.
Can we ask something the questionnaire never asked?
Often, yes. Answers are stored per respondent, so a cut nobody planned can still be run against data already collected. If the underlying question was never put to anyone, no method can invent the answer.
Do you set our positioning?
No. Your agency owns the positioning. Odyssey is the fact base they work from: what the category wants, what you are credited with, and where the two do not meet.
What is not in the product yet?
Strategy tooling, a single view for when the sources disagree, and an interface for AI visibility. They are named here rather than implied, because a page that hides them is harder to believe about the rest.
Is Odyssey a consultancy?
No. Odyssey is a technology company, built by research people who care about method and analytical depth rather than slide count.
Energy Signal is a new approach to insight work in our industry and serves as a strong complement to our own research.
Ola Sandberg
Head of Insight and Foresight, E.ON
Platform
Solutions
Resources
Privacy Policy
© All rights reserved