This update helps you see how AI assistants describe your brand, turn your analysis into presentations and reports with MixerMind Studio, and use your brand data in the tools you already work in.
This is the most substantial update we've made to Brand Signal. We're introducing:
a new way to measure how AI assistants position brands, grounded in the same customer needs and competitors as our survey data
file analysis in MixerMind, so you can bring your own data into the analysis
MixerMind Studio, which turns your analysis into presentations, documents and interactive pages
MCP and API access, so you can work with your Odyssey data in tools like Claude and ChatGPT or connect it to your own systems
They're all connected by one idea: making it easier to understand your brand across different sources, explore what's behind the numbers and use the findings wherever you work. Here's how it all fits together.
1. New data streams: Conversations and AI Visibility
Brand Signal already helps you understand what buyers think about your brand, how perceptions differ between audiences and how your positioning develops over time. Now you can put that picture alongside two other sources:
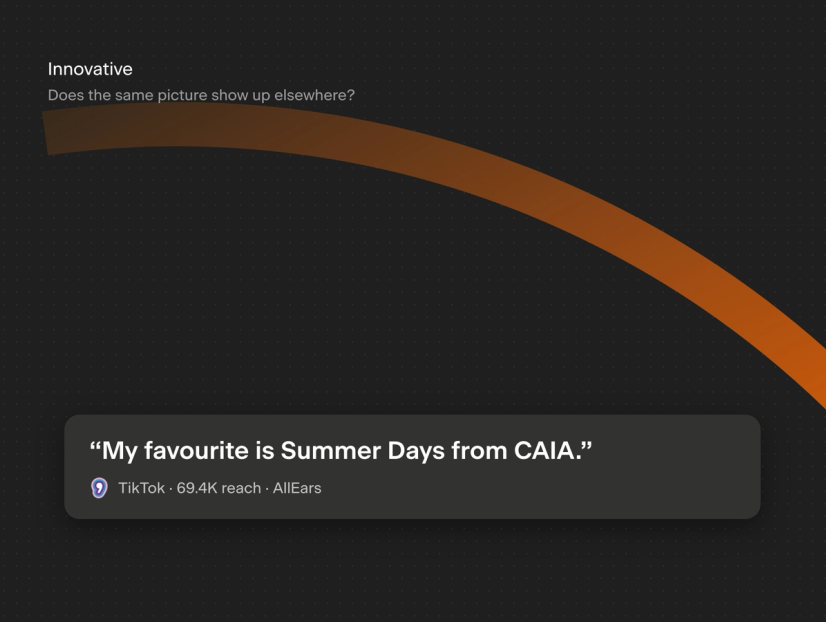
Conversations: What people say about brands in spoken media and online conversations, from podcasts and social video to broadcast.
AI Visibility: Which brands AI assistants like ChatGPT recommend, for which customer needs and how they describe them.
The important part is that all three are analysed against the same competitors and customer needs. Rather than three separate rankings or reports, you see where the sources agree and where they tell different stories.
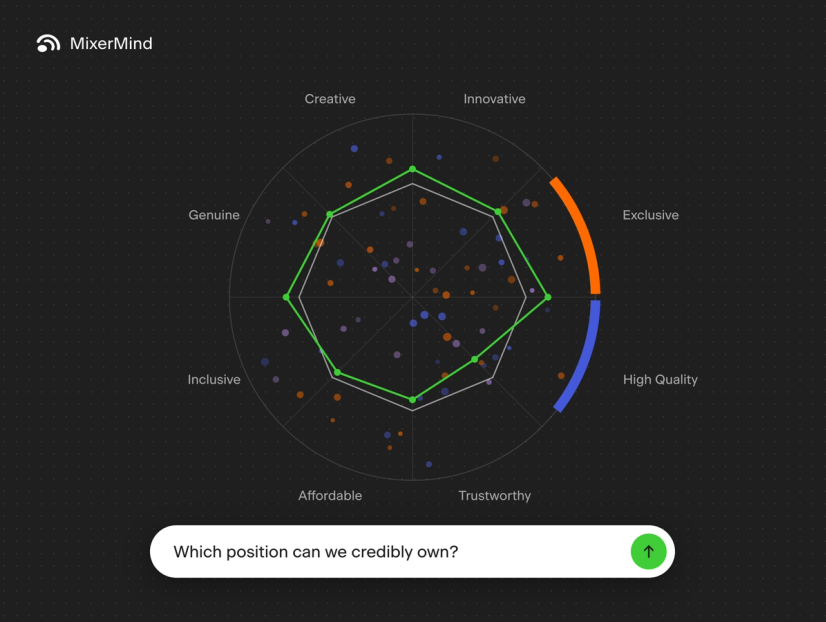
The same brand on the positioning map, from the survey, conversations and AI answers. Illustrative example.
Introducing AI Visibility by demand space
This is one of the biggest additions to Brand Signal. Most AI visibility reporting starts with a set of prompts and measures how often a brand appears in the answers. But the questions you choose shape the ranking, and a brand can appear often across a category while rarely being recommended for the need its buyers associate it with.
Our approach starts with the buyers. The questions asked to AI assistants are structured by the demand spaces in our surveys, so for each need you can see:
which brands appear
which brands are recommended first
which competitors AI suggests in your place
That means you can compare AI's picture of your brand directly with how buyers position it, within the same positioning framework. For example:
Buyers might strongly associate your brand with trust, while AI assistants are more likely to recommend it for low prices.
Your brand might lead buyer preference for a need but barely appear when someone asks AI for a recommendation.
Two new measures: AI Brand Profile and AI Brand Equity
Alongside AI Visibility by demand space, we're introducing two measures:
AI Brand Profile shows which needs and qualities AI associates with your brand, indexed against the market average. It follows the same positioning framework as the survey-based brand profile, so the two can be compared side by side.
AI Brand Equity applies our brand equity model to AI rankings and translates them into a model-based market share equivalent. It shows the relative strength of brands in AI recommendations rather than simply counting mentions, and it does not measure actual sales or sales impact.
Together, they make AI Visibility part of brand measurement and positioning rather than a standalone AI search metric. We'll share more about the methodology behind both in upcoming posts.
2. Go deeper with MixerMind, now with your own data
Seeing where sources disagree is a starting point. The next question is usually why. With MixerMind, our AI assistant within Brand Signal, you can dig into those differences and ask:
what's behind a change
which audiences are driving it
how the picture differs across competitors
MixerMind works across your available survey waves, segments and competitors, alongside Conversations and AI Visibility where enabled.
Illustrative example.
New: Bring your own files into the analysis
MixerMind can now analyse your own files, so you can combine your brand data with information from outside Odyssey.
Say you've run a campaign: attach your media plan with spend per region and ask how ad recognition developed in the regions where you invested the most. MixerMind brings the two sources together and shows which figures came from your file and which came from Odyssey. (This example uses a Signal that measures ad recognition.)
Illustrative example.
You can also work with sales figures, campaign briefs and other business documents in Excel, CSV, Word, PowerPoint, PDF or image format. It's a way to bring more of the context behind your marketing decisions into the same analysis.
3. From analysis to presentation, or into your own AI tools
Finding an interesting result is one thing. Getting it into a format that other people can use is another.
New: Create with MixerMind Studio
With MixerMind Studio, you can turn your analysis into Presentations, Documents or Interactive Pages with charts and explanations based on your Brand Signal data. After exploring differences between buyer perceptions and AI recommendations, for example, you can ask for a short presentation for your management team. You can then:
refine it in the same conversation, add charts or change the focus
download presentations as PowerPoint or PDF, and documents as Word or PDF
find everything you make in All your work, and what colleagues share with you in Shared work
Illustrative example.
New: MCP and API access to Brand Signal
For those who prefer working in their own tools, we've also added MCP and API access to survey data and AI answers:
MCP: Connect AI tools such as Claude and ChatGPT to your Odyssey account and ask questions about your brand data without opening Brand Signal. It uses your existing permissions, so you only reach the Signals available to your account.
API: Bring survey data and AI answers into your own dashboards and reporting, or combine them with sales, media and other business metrics.
Conversations data stays within the Odyssey platform.
Illustrative example.
The research behind our approach
Our new report, The new rules of brand measurement 2027, explores why survey data, organic conversations and AI recommendations can tell different stories about the same brands, and why understanding those differences matters.